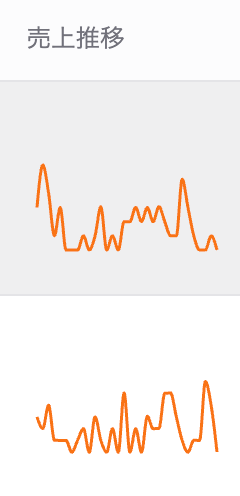
Graph display on the regular delivery page🛠️Feature ImprovementフィードバックデータソースAug 12, 2025I would like to see the number of subscriptions per month displayed in a graph like "Sales Trends" so that I can visualize the increase and decrease of subscriptions!Posted by Makoto Hyodo · Aug 12, 2025Status: Completed5 comments11
Log in to comment and vote
Comments5
snowfreaks619
Aug 20, 2025
視覚的に把握できるので、判断しやすくなりそうですね!
森田康介
Aug 20, 2025
推移見れると定期的に記録取らなくて済むので嬉しいです!
Makoto Hyodo
Aug 14, 2025
そうですね!月単位での増減が把握出来ると、施策の成果や長期的目標値も定めやすいです!
Takayuki Eiki
Aug 13, 2025
なるほどです。直近12ヶ月ぐらいの購読数推移ぐらいのスパンが理想でしょうか?
Makoto Hyodo
Aug 18, 2025
そうですね!
直近12ヶ月の購読数推移が見れれば参考になると思います!